Why Volume Profiles Matter for Solana Traders
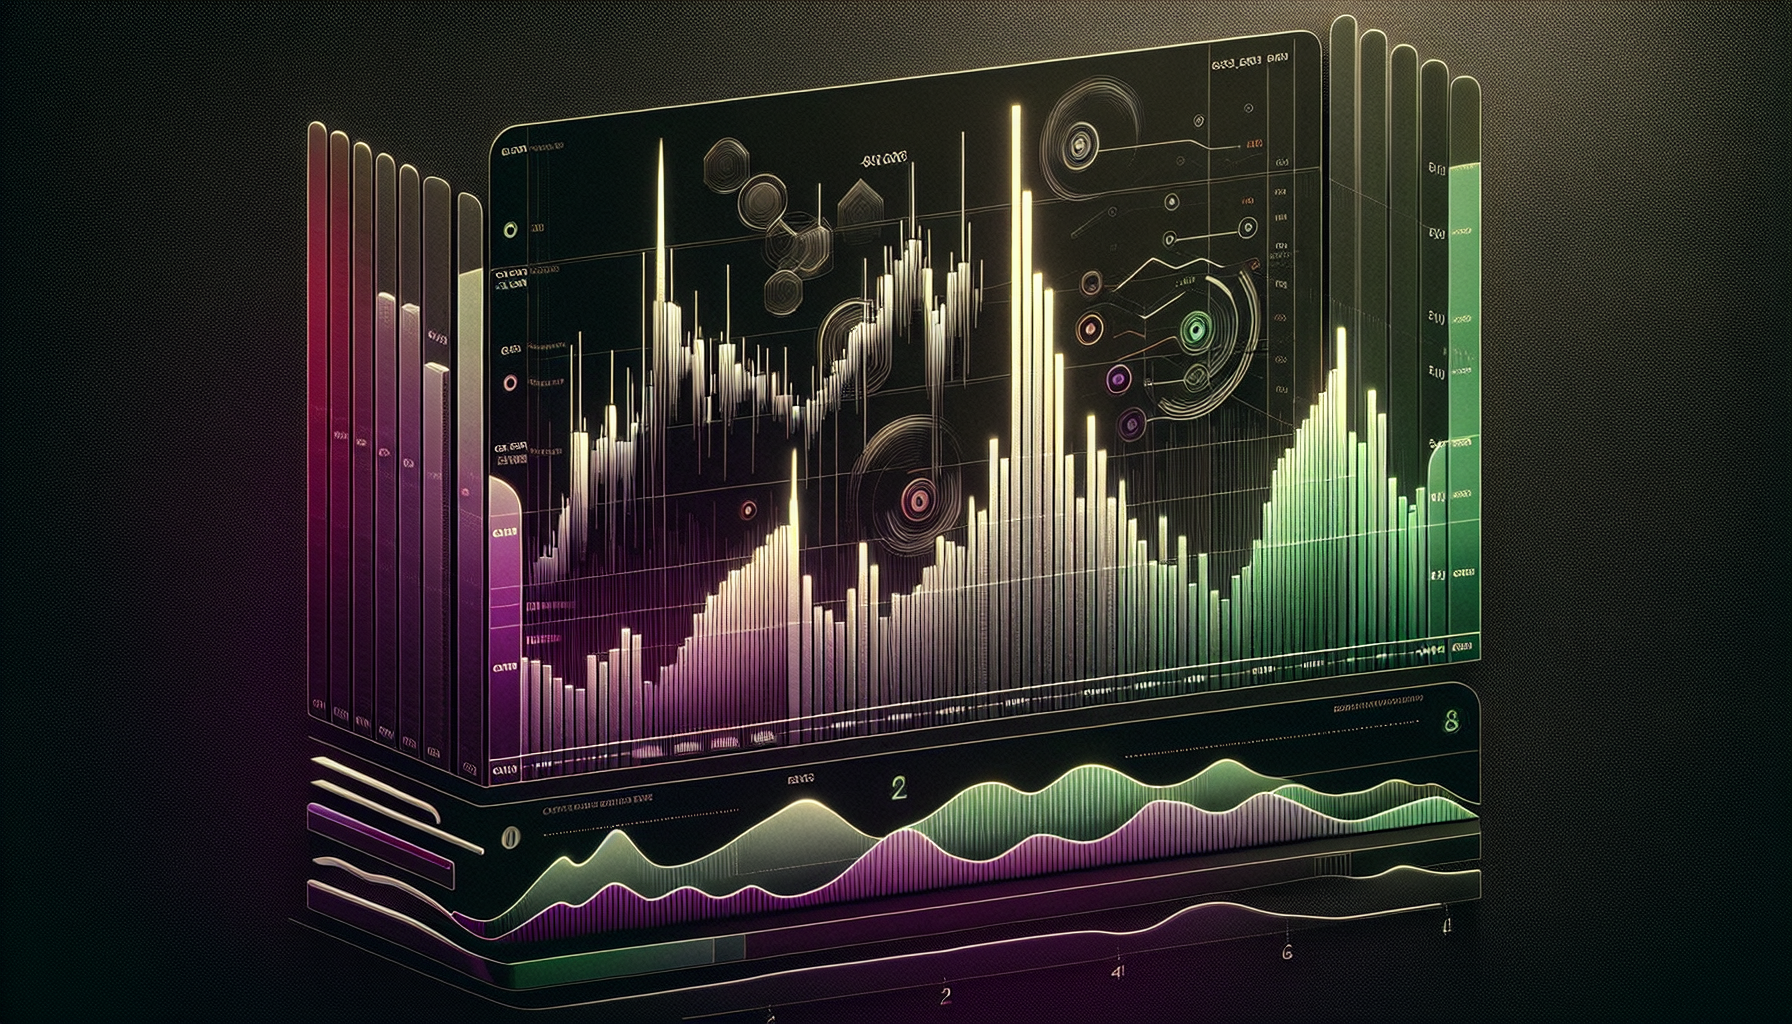
Most traders only look at price over time (candles) and volume over time (bars at the bottom of the chart. Volume profile adds a third dimension: volume at each price level.
Instead of showing how much traded per candle, a volume profile plots a horizontal histogram along the price axis, showing how much traded at each price in your chosen range. This is widely used in traditional markets and crypto on platforms like TradingView, Sierra Chart, and others. (tradingview.com)
For Solana traders, especially on volatile pairs and memecoins, this helps answer:
- Where did the market actually accept price (heavy trading)?
- Where did it just pass through quickly (thin volume)?
- Which prices are likely to act as support/resistance because big positions were built there?
This article focuses on the mechanics of volume profiles and how to apply them to Solana spot and perp trading.
What a Volume Profile Actually Shows
Most chart platforms define volume profile similarly:
A volume profile displays trading activity over a specified period at specified price levels, plotting a histogram that reveals dominant price levels based on volume. (tradingview.com)
Key points:
- It aggregates all trades in your chosen lookback (e.g., last 10 days, current session, visible range).
- It sums the volume at each price level, regardless of when during that period the trades occurred.
- It can optionally split volume into buy vs sell (up‑volume vs down‑volume) but the core idea is total volume at price. (tradingview.com)
On Solana markets (e.g., SOL/USDC perps, RAY/USDC spot):
- A thick part of the profile means a lot of trading happened there.
- A thin part means price moved through quickly with less participation.
This is why many institutional and professional traders treat volume profile as a market structure tool, not a prediction tool. It describes where the market did business, not what will happen next. (dextools.io)
Core Concepts: POC, Value Area, HVNs, LVNs
Most volume profile tools share the same basic components. You’ll see these terms in guides from major platforms and brokers. (dextools.io)
Point of Control (POC)
- Definition: The price level with the highest traded volume in your selected range.
- Interpretation:
- Often treated as the market’s fair price for that period.
- Acts as a magnet: price frequently revisits the POC after moving away.
- Can act as support/resistance when retested, because many positions were built there.
Value Area (VA)
- Definition: The price range that contains a chosen percentage of total volume, commonly 70% (sometimes configurable). (tradingview.com)
- Interpretation:
- Inside VA: price is trading where the market accepted value.
- Outside VA: price is exploring new territory; traders watch to see if this new area is accepted (volume builds) or rejected (price snaps back inside VA).
High Volume Nodes (HVNs)
- Definition: Local bulges in the profile where volume is significantly higher than neighboring prices.
- Interpretation:
- Represent acceptance zones or balance areas.
- Price often slows down, consolidates, or chops around HVNs.
- When revisited, they can act like strong support/resistance.
Low Volume Nodes (LVNs)
- Definition: Local dips or gaps in the profile where volume is significantly lower.
- Interpretation:
- Represent rejection zones or imbalance areas where price moved quickly.
- Price can move fast through LVNs because there’s less historical trading interest.
- Many traders look for breakouts through LVNs to ride directional moves. (dextools.io)
Types of Volume Profiles You’ll See
Most charting platforms (including TradingView) offer several profile modes. The terminology varies, but the ideas are consistent. (tradingview.com)
1. Fixed Range / Visible Range
- Fixed Range: You manually select a start and end point on the chart; the profile is calculated only for that segment.
- Visible Range (sometimes VPVR): The profile is automatically calculated for whatever part of the chart is currently visible.
Use cases for Solana traders:
- Analyze a specific rally or dump on SOL/USDC.
- Study one memecoin cycle from launch to peak.
- See where most trading happened in the current visible history before planning entries.
2. Session Profiles
Traditional markets have clear sessions (e.g., US cash session). Crypto trades 24/7, so platforms let you define your own session boundaries. Guides for crypto volume profile often suggest using UTC midnight or a synthetic close like New York 5pm as session splits. (quantum-algo.com)
Use cases:
- Daily session profiles on SOL perps to see each day’s POC and value area.
- Compare how today’s value area shifts relative to yesterday’s (overlapping vs trending profiles).
3. Composite Profiles
- A composite profile aggregates volume over a longer period (weeks or months).
- Useful to see macro acceptance zones on higher timeframes.
Use cases:
- Multi‑month profile on SOL/USDC to identify major HVNs that may act as long‑term support/resistance.
- Composite profile over an entire bull leg on a strong Solana ecosystem token.
How Volume Profile Differs from Standard Volume Indicators
Standard volume indicators (volume bars, OBV, VPT, VWAP) all use volume, but in different ways:
- Volume bars: show total volume per candle (time‑based). (en.wikipedia.org)
- On‑Balance Volume (OBV): adds/subtracts volume based on whether price closed up or down, to track accumulation/distribution. (en.wikipedia.org)
- VWAP: calculates the volume‑weighted average price over a period, used as a benchmark and dynamic support/resistance. (en.wikipedia.org)
- Volume Profile: organizes volume by price, not by time.
Practically:
- Volume bars tell you when big trading happened.
- Volume profile tells you where big trading happened.
Many professional guides emphasize that volume profile is reactive: it shows what already occurred, not a forecast. It’s best used to map structure and then combined with other tools (price action, order flow, funding, open interest) for trade decisions. (tradingview.com)
Practical Volume Profile Setups for Solana Markets
Below are concrete ways to use volume profiles on Solana spot and perp markets. These are based on patterns widely discussed in institutional and retail education around volume profile, adapted to crypto’s 24/7 nature. (quantum-algo.com)
1. Trading Reversions to the POC
Idea: When price moves away from a well‑established POC without building new volume, it often reverts back to that POC.
Steps:
- Use a fixed‑range profile over the last impulsive move on SOL/USDC.
- Mark the POC and value area.
- If price breaks away from the value area but volume remains thin in the new zone (profile not building), watch for:
- Failed breakout candles
- Rejection wicks back into prior value
- Consider mean‑reversion trades back toward the POC, with stops beyond the rejection area.
When it can fail:
- If a new trend leg starts and builds a new high‑volume area at higher/lower prices, the old POC can lose relevance.
2. Using HVNs as Support/Resistance
Idea: HVNs represent heavy participation and often act as strong levels.
Steps:
- On a higher timeframe (4H, 1D) SOL chart, plot a composite profile for the last few months.
- Identify 2–4 major HVNs.
- Treat these as zones, not exact lines.
- Look for confluence with:
- Prior swing highs/lows
- VWAP bands
- Key funding/open interest shifts on perps
Use cases:
- Plan swing entries near HVNs with tight invalidation.
- Take partial profits as price approaches a major HVN from below or above.
3. Trading Through LVN “Gaps”
Idea: LVNs are thin areas where price historically moved quickly. If price re‑enters an LVN, it can again move fast until it reaches the next HVN.
Steps:
- Use a visible range profile on a trending Solana pair.
- Mark LVN zones between major HVNs.
- When price breaks into an LVN with momentum (e.g., strong candle, rising volume, supportive funding/oi on perps):
- Consider momentum trades targeting the next HVN.
- Place stops just back inside the prior HVN or above/below the LVN boundary.
Risks:
- LVN moves can be sharp in both directions; invalidation must be clear.
- In thin Solana memecoins, spoofed or wash‑traded volume can distort profiles, so always cross‑check with on‑chain metrics and DEX analytics.
4. Session‑to‑Session Shifts on SOL Perps
Many volume profile guides emphasize reading session profiles to understand whether value is shifting up, down, or overlapping. (quantum-algo.com)
Adaptation to crypto:
- Define a daily session (e.g., UTC 00:00–23:59) for SOL perps.
- Plot a profile for each day.
- Compare today’s value area and POC to yesterday’s:
- Value higher, POC higher: bullish bias; buyers accepting higher prices.
- Value lower, POC lower: bearish bias; sellers accepting lower prices.
- Overlapping value, similar POC: balance/chop; fade extremes rather than chase breakouts.
Combine with:
- Funding rate and open interest data from your perp venue.
- Liquidation heatmaps to see where forced flows may interact with HVNs/LVNs.
Solana‑Specific Considerations When Using Volume Profiles
1. 24/7 Trading and Session Choice
Unlike equities, Solana markets never close. Crypto‑focused volume profile guides highlight the need to define your own sessions for daily profiles. Common choices are:
- UTC midnight
- New York 5pm close equivalent
Pick one and stay consistent so you can compare sessions over time. (quantum-algo.com)
2. Fragmented Liquidity Across DEXes and CEXes
Solana trading volume is split across:
- Centralized exchanges (e.g., Binance, Coinbase, Bybit perps for SOL).
- On‑chain DEXes and aggregators (Raydium, Orca, Meteora, Jupiter routes, etc.).
Most chart platforms pull data from a single venue (often a major CEX). That means your volume profile reflects that venue’s order flow, not the entire Solana ecosystem.
Practical tips:
- For perp trading, use the perp venue’s own chart/profile; that’s the flow that matters for your fills and liquidations.
- For spot Solana tokens, cross‑check:
- CEX chart (if listed) for broader sentiment.
- DEX analytics (Birdeye, DexScreener) for on‑chain volume distribution and liquidity depth.
3. Wash Trading and Artificial Volume
On smaller Solana tokens, especially new launches, wash trading bots can create artificial volume to game rankings or attract attention. There are even services explicitly advertising volume generation for Solana DEX pairs. (solana-volume.com)
Implications for volume profile:
- Artificial volume can create fake HVNs that don’t represent real organic interest.
- LVNs may be less meaningful if the underlying volume is mostly bot churn.
Mitigation:
- Cross‑check profile levels with:
- Order book depth (where available).
- On‑chain holder distribution and transfer patterns (via Solscan or Helius‑powered explorers).
- DEX analytics showing unique traders vs total volume.
4. Combining Volume Profile with On‑Chain Data
Volume profile is off‑chain market structure. On Solana you can enhance it with:
- On‑chain volume and liquidity: via Birdeye or DexScreener.
- Whale movements: large transfers to/from exchanges or DEX pools.
- Program‑level events: e.g., big liquidity additions/removals on Raydium or Meteora CLMM pools.
Using both:
- If a major HVN on your SOL/USDC profile lines up with a large on‑chain liquidity band in a CLMM pool, that level often becomes even more important.
- If a token’s biggest HVN coincides with heavy exchange inflows from whales, that may mark a strong distribution or accumulation zone.
Common Mistakes When Using Volume Profiles
Based on mainstream educational material and trader discussions, several pitfalls come up repeatedly. (dextools.io)
- Treating volume profile as a prediction tool
-
It’s descriptive, not predictive. Use it to map structure, then wait for price action or order‑flow confirmation.
-
Ignoring timeframe context
- A strong HVN on the 5‑minute chart may be irrelevant on the daily.
-
Always align your profile timeframe with your trade horizon.
-
Over‑fitting the range
- Constantly redrawing tiny fixed ranges to justify a bias leads to noise.
-
Start with a higher‑timeframe composite, then zoom in.
-
Forgetting about liquidity and slippage
- A level can be structurally important but still dangerous if the DEX pool is thin.
-
Check real liquidity on Solana DEXes before planning large trades.
-
Ignoring regime shifts
- When a major fundamental or macro event hits (protocol exploit, regulatory news, funding changes), old profiles can lose relevance quickly.
How to Start Using Volume Profiles in Your Solana Trading
A practical onboarding path:
- Pick a primary charting platform with solid volume profile tools (e.g., TradingView, which documents multiple profile types and settings). (tradingview.com)
- Choose one or two Solana markets you trade most (e.g., SOL/USDC perps, a top‑liquidity ecosystem token).
- Build a multi‑timeframe view:
- Weekly or daily composite profile to see major HVNs/LVNs.
- 1H/15m fixed‑range profiles around recent moves for tactical entries.
- Define simple rules:
- Only trade in the direction of the session value shift (higher vs lower).
- Prefer entries near HVNs with clear invalidation.
- Target LVN gaps for momentum trades when price breaks into them with confirmation.
- Log every trade where volume profile influenced your decision.
- Note which levels mattered, which didn’t, and how it interacted with on‑chain data.
Over time, you’ll see where volume profile genuinely adds edge to your Solana trading and where it’s just noise.
Final Thoughts
Volume profiles are not magic, but they give you something most traders never see: a clear map of where the market actually traded size. For Solana traders dealing with fast moves, fragmented liquidity, and sometimes questionable volume, that structural view can be the difference between chasing random candles and trading around real areas of interest.
Use volume profile to:
- Identify fair value zones (value areas and POCs).
- Mark strong support/resistance (HVNs).
- Spot potential fast‑move zones (LVNs).
- Then layer on price action, on‑chain data, and risk management.
Treat it as a framework for reading the market, not a signal generator, and it can become one of the more robust tools in your Solana trading toolkit.